

Your ACoS is 29%.
Is that good?
You check a few forums. Someone says anything under 30% is fine. Someone else says you should target 15%. A third person says it depends on your margins.
The third answer is the one that matters most.
Amazon Ads benchmarks are useful because they give you context. They help you understand how CPC, ACoS, CTR, conversion rate, and ROAS compare with the broader market.
But a benchmark cannot tell you whether your campaign is profitable.
That depends on your product, margins, Amazon fees, fulfilment costs, conversion rate, advertising objective, and the stage of your business.
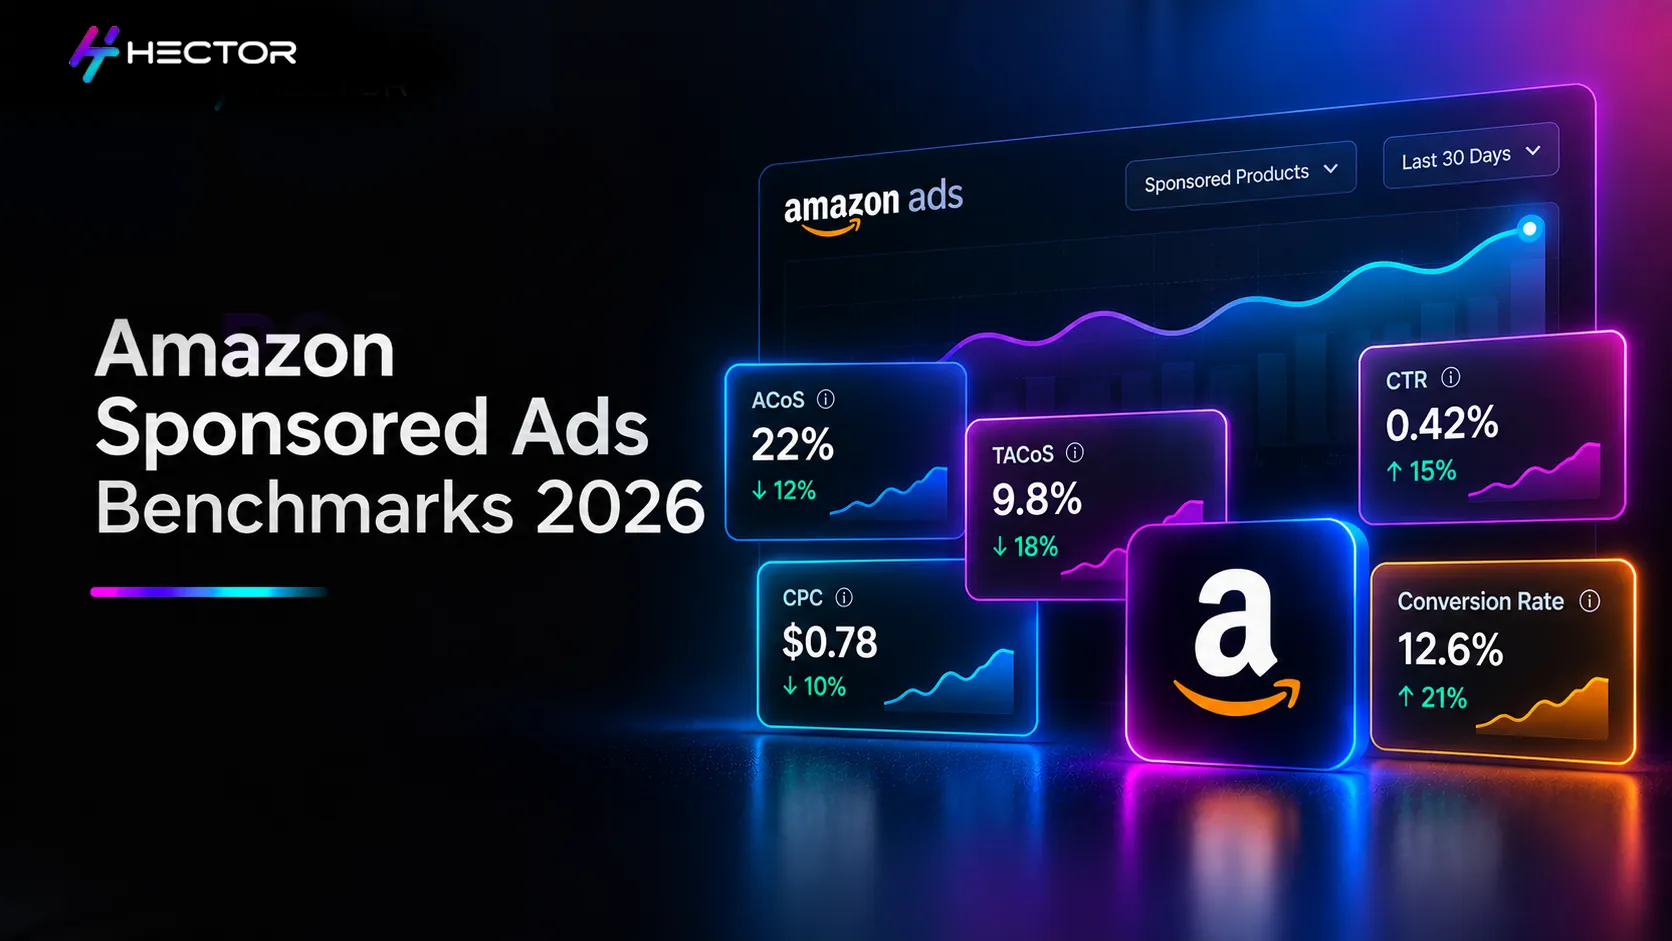
This report brings together directional 2026 benchmark data for six metrics: ACoS, CPC, CTR, conversion rate, ROAS, and TACoS.
Think of a benchmark like a race leaderboard. It tells you roughly how other runners are performing. It does not tell you how fast you need to run. Your economics determines your break-even ACoS. Your target ROAS depends on your contribution margin and growth objective. Your acceptable CPC depends on how efficiently those clicks convert into profitable sales. A market benchmark answers a different question: “How does my performance compare with the accounts represented in this dataset?” That can be useful for diagnosis. If your CPC is significantly higher than comparable products, investigate why. If your CTR trails comparable campaigns, look at targeting, placement, pricing, imagery, and offer competitiveness. But don't set your campaign target to the industry average. Benchmarks are context, not goals. The following ranges are compiled from third-party Amazon advertising benchmark sources. They should be treated as directional, as methodologies and advertiser samples differ across providers. These figures do not represent official Amazon Ads platform averages. They combine observations from third-party datasets with different samples and methodologies. Use them to identify questions worth investigating, rather than automatically raising or lowering bids to match the average. Category context matters because shoppers do not behave the same way when buying a book, a television, groceries, or skincare. The following ranges are directional figures compiled from third-party industry benchmark data. They are useful for orientation. Your actual performance will depend on factors such as marketplace, product price, reviews, conversion rate, targeting, placement, competition, and campaign strategy. The first question should not be: “How do I bring my ACoS down to the industry average?” Ask instead: “Is my current ACoS profitable and appropriate for what this campaign is trying to achieve?” A launch campaign may intentionally tolerate higher acquisition costs than a mature profitability-focused campaign. If your ACoS is above both your benchmark reference and your own target, start investigating the underlying drivers. Pull the search term report and look at where the spend is actually going. Which search terms are generating sales? Which ones are accumulating clicks without converting? Which terms have enough data to justify a bid adjustment or negative targeting decision? Don't make decisions simply because a keyword has been running for a fixed number of days. Make them when sufficient performance data has accumulated. Rule-based Amazon Ads Optimization can then apply those decisions consistently. Campaign structure affects how easily you can diagnose performance. Broad, phrase, and exact match can coexist within a manual keyword campaign. Separating them into different campaigns can provide additional budget and campaign-level control, but it is not mandatory. The important question is whether your structure allows you to understand where spending, sales, and inefficiency originate. Sometimes what looks like a PPC problem starts after the click. Look at: Main image Price Ratings and reviews Product detail page Offer competitiveness Availability Conversion rate If shoppers are clicking but not buying, reducing bids alone may not solve the underlying problem. CPC is influenced by several factors, including auction competition, your bids, targeting, placement, and bidding strategy. A high CPC is, therefore, a symptom that requires context. Before lowering bids across the account, ask: Are those expensive clicks converting? A $1.80 CPC with a strong conversion rate can be more efficient than a $0.80 CPC generating almost no sales. Look for opportunities to test more relevant keywords, different match types, product targeting, and placement strategies. Long-tail keywords can sometimes yield less competitive, more specific traffic, but they are not inherently cheaper or more efficient. Let your own campaign data decide. CTR tells you whether shoppers who see your ad are choosing to click it. That decision can be influenced by: Main product image Product title Price Ratings and reviews Relevance to the search query Placement Promotions Competitive products appearing alongside yours A low CTR should therefore trigger two investigations. First, check whether you are reaching relevant shoppers. Second, check whether your product appears competitive. Changing the main image may help when the creative is the problem. Tightening targeting may help when the wrong shoppers are seeing the ad. The campaign and the listing both matter. If shoppers are clicking but not buying, start by looking at what happens after the click. Price, ratings, reviews, images, product information, availability, and offer competitiveness can all influence conversion. But don't ignore the traffic itself. A campaign can generate poor conversion rates because its targeting is too broad, its search terms are weak, or its placements attract shoppers with different intent. Look at the conversion rate alongside search term, target, and placement performance before concluding that the listing is the problem. ACoS and TACoS answer different questions. ACoS = Ad Spend ÷ Ad-Attributed Sales It tells you how much you spent on advertising relative to the sales attributed to those ads. TACoS = Total Ad Spend ÷ Total Sales It shows how large your advertising spend is relative to the business's total sales. Suppose you spend $10,000 on advertising and generate $100,000 in total sales. Your TACoS is 10%. If you spend the same $10,000 next month and total sales increase to $120,000, TACoS falls to 8.3%. That can be a useful signal. But TACoS does not tell you why total sales changed. Organic sales could be influenced by advertising, seasonality, pricing, reviews, promotions, brand demand, competition, inventory, and several other factors. Use TACoS as a business-level efficiency metric, not as proof that advertising caused organic growth. There is no universal answer. A business aggressively investing in growth may intentionally operate at a higher TACoS. A mature product with strong organic sales may be able to operate at a much lower TACoS. A low TACoS is not automatically better, either. Cutting advertising may improve TACoS mathematically while reducing profitable sales and overall growth. Instead of chasing a universal 10%, 15%, or 20% number, ask: Is our advertising spend delivering an acceptable return while supporting the business's overall sales and profitability objectives? Then monitor the trend. If TACoS is falling while revenue and profit are growing, investigate what is driving the improvement. If TACoS is rising sharply, determine whether the increase reflects intentional investment or deteriorating efficiency. The best benchmark is rarely a single industry-wide number. Use benchmarks in layers. Start with your own historical performance. Then compare with relevant category data. Then look at the broader market. For example, imagine your Sponsored Products ACoS is 35%. The cross-category benchmark in the datasets reviewed here may suggest that it is slightly above average. But that still doesn't answer the most important question: Can your product profitably support a 35% ACoS? If your break-even ACoS is 45%, the campaign may be working well. If your break-even ACoS is 22%, you have a problem regardless of the industry average. This is why benchmark reports should start conversations, not end them. Two campaigns selling the same product can legitimately have different performance targets. A campaign focused on profitable exact-match terms may prioritize ACoS. A discovery campaign may accept lower short-term efficiency to identify useful search terms or product targets. A launch campaign may prioritize sales and visibility. A mature campaign may put more emphasis on contribution margin and sustainable ROAS. Campaign age alone should not determine the benchmark. The objective should. Amazon advertising performance moves. CPC changes. Conversion rates change. Competitors change prices. Events increase traffic. Promotions affect conversion. Inventory changes. If performance swings by time of day, Amazon PPC Dayparting can adjust bids and budgets by the hour. A single week can therefore produce a misleading comparison. Choose an evaluation period that gives you enough clicks, spend, and conversions to make a meaningful decision while accounting for major campaign or seasonal changes. For some high-volume campaigns that may be relatively short. For lower-volume campaigns, it may require a much longer period. The objective is sufficient data, not an arbitrary number of days. Amazon Ads benchmarks are useful when they help you ask better questions. They become dangerous when they turn into universal targets. A 30% ACoS is not automatically good. A 4x ROAS is not automatically strong. A 10% TACoS is not automatically healthy. And a CPC above the industry average is not automatically expensive. The right benchmark gives you context. Your product economics tell you what to do with it. Use both, and use a platform like Hector Ai to track your ACoS, CPC, CTR, conversion rate, ROAS and TACoS against your own targets. What a Benchmark Actually Is, and What It Is Not
2026 Cross-Category Benchmarks at a Glance
The important word here is directional.Amazon Sponsored Products Benchmarks by Category
These figures should not be treated as Amazon-defined category medians.What to Do When Your ACoS Is Above the Benchmark
Check Your Search Terms
Check Your Campaign Structure
Check Your Listing and Offer
What to Do When Your CPC Is Higher Than Expected
What to Do When CTR Is Below Benchmark
What to Do When Conversion Rate Trails Your Reference Point
TACoS: Useful, but Often Misunderstood
So, What Is a Healthy TACoS?
How to Use Amazon Advertising Benchmarks Properly
Match the Benchmark to the Campaign Objective
Look at Trends, Not Isolated Weeks
The Bottom Line